1QFY2020 Result Update | Media
August 13, 2019
TV Today Network
BUY
CMP
`313
Performance Update
Target Price
`456
Y/E March (` cr)
1QFY20
1QFY19
% yoy 4QFY19
% qoq
Investment Period
12 Months
Net sales
245
188
30.2
175
40
EBITDA
74
62
19.2
33
129
Stock Info
EBITDA margin (%)
30.4
33.2
(279bp)
18.6
1,175bp
Sector
Media
Adjusted PAT
51
40
27.3
24
116
Market Cap (` cr)
1,873
Source: Company, Angel Research
Net Debt (` cr)
292
For 1QFY2020, TV Today Network Ltd (TTNL) posted results above our
expectations on both top-line as well as bottom-line fronts. Revenue grew by
Beta
1.1
~30% yoy to `245cr due to strong ad revenue growth. On the operating front,
52 Week High / Low
467/237
margins contracted by 279bps yoy. However, PAT grew ~27% yoy to `51cr.
Avg. Daily Volume
4,171
Higher ad spends boosted the overall top-line growth: The company’s top-line
grew by 30% yoy to `245cr due to strong ad revenue growth (up ~31% yoy to
Face Value (`)
5
`208cr). Other segment grew by ~62% to `28cr. However, the company has
BSE Sensex
36,436
reported de- growth in radio segment (`4cr vs. ~`6cr in 1QFY2019).
Nifty
11,071
Strong PAT growth driven by robust top-line: On the operating front, margins
Reuters Code
TVTO.BO
contracted by 279bps yoy. However, PAT grew ~27% yoy to `51cr. Segment
wise, advertisement business witnessed EBIT margin contraction of 506bps yoy.
Bloomberg Code
TVTN.IN
Further, radio business reported EBIT level loss of `4cr yoy vs. `1cr (loss) in
1QFY2019.
Outlook and Valuation: Going forward, we expect TTNL to report net revenue
Shareholding Pattern (%)
CAGR of ~14% over FY2019-21E to ~`962cr and net profit CAGR of ~12%
Promoters
58.0
over the same period to `170cr on the back of leadership position in Hindi
news genre and upcoming elections. TTNL is a debt free company with decent
MF / Banks / Indian Fls
15.0
cash on balance sheet. At the current market price of `313, the stock trades at
a PE of 12.1x and 11.0x its FY2020E and FY2021E EPS of `25.8 and `28.5
FII / NRIs / OCBs
10.8
respectively. We recommend BUY on TTNL with a Target Price of `456.
Indian Public / Others
16.2
Key financials
Y/E March (` cr)
FY2018
FY2019
FY2020E
FY2021E
Abs. (%)
3m 1yr
3yr
Net sales
721
742
880
962
Sensex
0.1
(1.2)
33.8
% chg
10.5
3.0
18.5
9.3
Net profit
119
131
154
170
TTNL
3.9
(29)
5.2
% chg
34.7
2.5
17.5
10.2
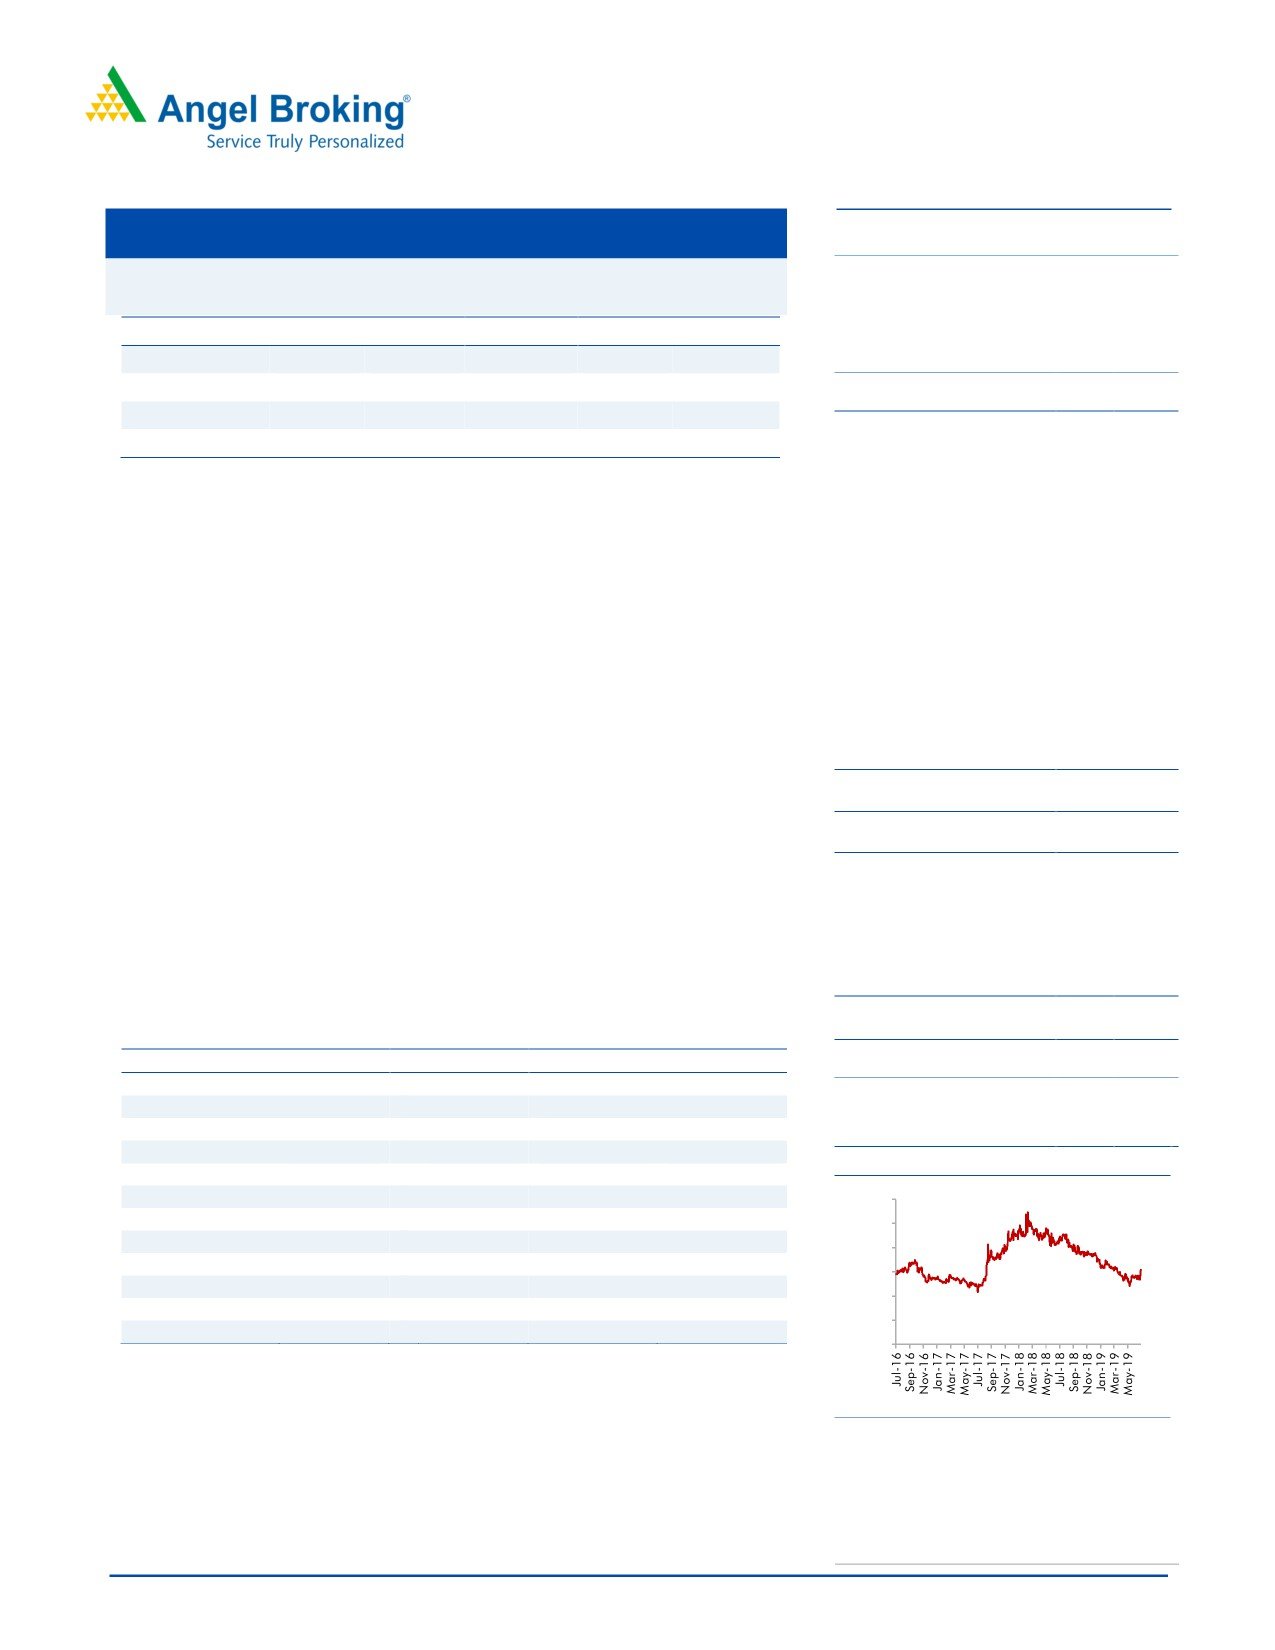
3-year price chart
EBITDA margin (%)
26.9
26.9
27.6
28.0
EPS (`)
21.4
22.0
25.8
28.5
600
P/E (x)
14.6
14.2
12.1
11.0
500
P/BV (x)
2.8
2.4
2.5
3.3
400
RoE (%)
18.0
16.9
20.3
29.8
300
RoCE (%)
24.5
21.5
26.8
39.6
200
EV/Sales (x)
2.3
2.1
1.8
1.9
100
EV/EBITDA (x)
8.6
7.9
6.7
6.8
0
Source: Company, Angel Research, Note: CMP as of February 13, 2019
Source: Company, Angel Research
Amarjeet S Maurya
022-39357800 Ext: 6831
Please refer to important disclosures at the end of this report
1
TV Today Network | 1QFY2020 Result Update
Exhibit 1: 1QFY2020 Performance
Y/E March (` cr)
1QFY20
1QFY19
% yoy
4QFY19
% qoq
FY2020
FY2019
% chg
Net Sales
245
188
30.2
175
40.2
739
691
6.9
Staff Costs
66
55
20.6
55
21.4
222
193
15.3
(% of Sales)
27.0
29.2
(214)
31.2
(419)
30.0
27.9
219
Other Expenses
104
71
47.2
88
19.1
319
302
5.5
(% of Sales)
42.6
37.7
493
50.2
(757)
43.1
43.7
(59)
Total Expenditure
171
126
35.6
142
20.0
541
495
9.3
Operating Profit
74
62
19.2
33
128.8
198
197
0.9
OPM
30.4
33.2
18.6
26.8
28.4
Interest
1
0
236.2
0
237.3
1
1
5.1
Depreciation
10
8
22.5
8
20.8
31.5
31.3
0.7
Other Income
14
7
97.5
15
(3.1)
36.7
23.4
56.5
PBT (excl. Ext Items)
78
62
27.2
39
100.1
203
188
7.8
Ext (Income)/Expense
-
-
-
-
PBT (incl. Ext Items)
78
62
27.2
39
100.1
203
188
7.8
(% of Sales)
32.0
32.7
22.4
27.4
27.2
Provision for Taxation
27
22
16
72.6
64.5
12.6
(% of PBT)
34.9
34.9
39.6
35.8
34.3
Reported PAT
51
40
27.3
24
115.6
130
123
5.3
PATM
20.8
21.3
13.5
17.6
17.9
Minority Interest After NP
Extra-ordinary Items
(14)
Reported PAT
51
40
27.3
24
115.6
130
137
(5.2)
PATM
20.8
21.3
13.5
17.6
19.8
Source: Company, Angel Research
August 13, 2019
2
TV Today Network | 1QFY2020 Result Update
Outlook and Valuation
Going forward, we expect TTNL to report net revenue CAGR of ~14% over
FY2019-21E to ~`962cr and net profit CAGR of ~12% over the same period
to `170cr on the back of leadership position in Hindi news genre and upcoming
elections. TTNL is a debt free company with decent cash on balance sheet. At
the current market price of `313, the stock trades at a PE of 12.1x and 11.0x its
FY2020E and FY2021E EPS of `25.8 and `28.5 respectively. We recommend
BUY on TTNL with a Target Price of `456.
Risks
1) Losing leadership position in viewership ranking could affect the company’s
advertisement revenue, and hence poses a downside risk to our estimates.
2)
Overall slowdown in the Indian economy could impact the advertisement
spends, which could be negative for TTNL.
3) Delay in digitalization could impact the company’s subscription revenue
growth.
Company Background
TV Today Network (TTNL) is one of the leading Indian Hindi and English news
television networks. The company's operating segments include television (TV)
broadcasting and radio broadcasting. The company operates four news channels,
which include Aaj Tak, India Today (earlier know as Headlines Today), TEZ and Dilli
Aaj Tak. The company is also engaged in publishing, and its publications include
India Today, Business Today, etc. Moreover, TTNL is associated with well know
anchors like Rajdeep Sardesai and Karan Thapar. Living Media India Limited is the
holding company of TTNL.
August 13, 2019
3
TV Today Network | 1QFY2020 Result Update
Consolidated Profit & Loss Statement
Y/E March (` cr)
FY2017
FY2018
FY2019
FY2020E FY2021E
Total operating income
652
721
742
880
962
% chg
12.2
10.5
3.0
18.5
9.3
Total Expenditure
490
527
543
637
693
Employee Cost
181
202
223
229
250
Selling & Administrative Expenses
-
-
-
-
-
Others Expenses
309
325
320
408
442
EBITDA
163
194
200
243
269
% chg
23.7
19.2
3.0
21.7
10.9
(% of Net Sales)
24.9
26.9
26.9
27.6
28.0
Depreciation& Amortisation
29
31
32
39
42
EBIT
134
162
168
204
228
% chg
33.0
21.5
3.5
21.4
11.5
(% of Net Sales)
20.5
22.5
22.6
23.2
23.7
Interest & other Charges
8
4
1
4
4
Other Income
29
25
37
30
30
(% of PBT)
19.0
13.5
18.0
13.0
11.8
Share in profit of Associates
-
-
-
-
-
Recurring PBT
155
183
204
230
254
% chg
34.8
18.6
11.2
12.8
10.2
Prior Period & Extraordinary Expense/(Inc.)
-
-
-
-
-
PBT (reported)
155
183
204
230
254
Tax
54
64
73
76
84
(% of PBT)
35.0
35.1
35.7
33.0
33.0
PAT (reported)
100
119
131
154
170
Add: Share of earnings of associate
-
-
-
-
-
ADJ. PAT
100
119
131
154
170
% chg
21.5
34.7
2.5
17.5
10.2
(% of Net Sales)
15.4
16.5
17.7
17.5
17.7
Basic EPS (`)
15.9
21.4
22.0
25.8
28.5
Fully Diluted EPS (`)
15.9
21.4
22.0
25.8
28.5
% chg
21.5
34.7
2.5
17.5
10.2
August 13, 2019
4
TV Today Network | 1QFY2020 Result Update
Consolidated Balance Sheet
Y/E March (` cr)
FY2017
FY2018
FY2019
FY2020E FY2021E
SOURCES OF FUNDS
Equity Share Capital
30
30
30
30
31
Reserves& Surplus
540
632
748
729
539
Shareholders Funds
570
662
777
759
570
Total Loans
35
-
3
3
3
Deferred Tax Liability
8
11
14
14
14
Total Liabilities
613
673
794
786
596
APPLICATION OF FUNDS
Gross Block
257
343
362
403
433
Less: Acc. Depreciation
59
85
115
154
196
Net Block
199
258
247
249
237
Capital Work-in-Progress
3
2
4
4
4
Investments
6
-
0
-
-
Current Assets
525
560
684
707
569
Sundry Debtors
163
185
185
219
237
Cash
263
199
291
350
190
Loans & Advances
61
70
174
97
101
Other Assets
36
104
32
38
38
Current liabilities
143
173
173
205
246
Net Current Assets
382
387
511
502
323
Deferred Tax Asset
23
25
31
31
31
Mis. Exp. not written off
-
-
-
-
-
Total Assets
613
673
794
786
596
August 13, 2019
5
TV Today Network | 1QFY2020 Result Update
Consolidated Balance Sheet
Y/E March (` cr)
FY2017
FY2018
FY2019
FY2020E FY2021E
Profit before tax
153
183
204
230
254
Depreciation
29
31
32
39
42
Change in Working Capital
(98)
(1)
(112)
69
18
Interest / Dividend (Net)
(10)
(1)
(25)
4
4
Direct taxes paid
(59)
(63)
(77)
(76)
(84)
Others
(2)
7
8
-
-
Cash Flow from Operations
14
158
30
266
234
(Inc.)/ Dec. in Fixed Assets
4
(93)
(1)
(30)
(30)
(Inc.)/ Dec. in Investments
1
6
-
-
-
Cash Flow from Investing
3
(99)
(1)
(30)
(30)
Issue of Equity
-
-
0
-
-
Inc./(Dec.) in loans
0
-
-
-
-
Dividend Paid (Incl. Tax)
(10)
(12)
(13)
(173)
(360)
Others
86
(110)
76
(4)
(4)
Cash Flow from Financing
76
(122)
63
(177)
(364)
Inc./(Dec.) in Cash
93
(64)
91
59
(160)
Opening Cash balances
170
263
199
291
350
Closing Cash balances
263
199
291
350
190
Source: Company, Angel Research
August 13, 2019
6
TV Today Network | 1QFY2020 Result Update
Key Ratios
Y/E March
FY2017
FY2018
FY2019
FY2020E FY2021E
Valuation Ratio (x)
P/E (on FDEPS)
19.7
14.6
14.2
12.1
11.0
P/CEPS
14.4
12.4
11.5
9.7
8.8
P/BV
3.3
2.8
2.4
2.5
3.3
Dividend yield (%)
0.6
0.8
0.8
9.2
19.3
EV/Sales
2.5
2.3
2.1
1.7
1.7
EV/EBITDA
10.0
8.6
7.9
6.3
6.2
EV / Total Assets
2.2
2.0
1.6
1.5
2.0
Per Share Data (Rs)
EPS (Basic)
15.9
21.4
22.0
25.8
28.5
EPS (fully diluted)
15.9
21.4
22.0
25.8
28.5
Cash EPS
21.7
25.2
27.3
32.3
35.5
DPS
1.9
2.6
2.6
28.9
60.4
Book Value
95.6
110.9
130.3
127.2
95.5
Returns (%)
ROCE
22.1
24.5
21.5
26.8
39.7
Angel ROIC (Pre-tax)
39.8
35.1
34.3
49.5
59.4
ROE
17.6
18.0
16.9
20.3
29.8
Turnover ratios (x)
Asset Turnover (Gross Block)
2.5
2.1
2.0
2.2
2.2
Inventory / Sales (days)
1
1
1
1
1
Receivables (days)
91
94
91
91
90
Payables (days)
49
44
41
41
44
Working capital cycle (ex-cash) (days)
44
50
51
51
47
Source: Company, Angel Research
August 13, 2019
7
TV Today Network | 1QFY2020 Result Update
Research Team Tel: 022 - 39357800
DISCLAIMER
Angel Broking Limited (hereinafter referred to as “Angel”) is a registered Member of National Stock Exchange of India Limited, Bombay
Stock Exchange Limited and Metropolitan Stock Exchange Limited. It is also registered as a Depository Participant with CDSL and Portfolio
Manager and Investment Adviser with SEBI. It also has registration with AMFI as a Mutual Fund Distributor. Angel Broking Limited is a
registered entity with SEBI for Research Analyst in terms of SEBI (Research Analyst) Regulations, 2014 vide registration number
INH000000164. Angel or its associates has not been debarred/ suspended by SEBI or any other regulatory authority for accessing
/dealing in securities Market. Angel or its associates/analyst has not received any compensation / managed or co-managed public
offering of securities of the company covered by Analyst during the past twelve months.
This document is solely for the personal information of the recipient, and must not be singularly used as the basis of any investment
decision. Nothing in this document should be construed as investment or financial advice. Each recipient of this document should make
such investigations as they deem necessary to arrive at an independent evaluation of an investment in the securities of the companies
referred to in this document (including the merits and risks involved), and should consult their own advisors to determine the merits and
risks of such an investment.
Reports based on technical and derivative analysis center on studying charts of a stock's price movement, outstanding positions and
trading volume, as opposed to focusing on a company's fundamentals and, as such, may not match with a report on a company's
fundamentals. Investors are advised to refer the Fundamental and Technical Research Reports available on our website to evaluate the
contrary view, if any
The information in this document has been printed on the basis of publicly available information, internal data and other reliable sources
believed to be true, but we do not represent that it is accurate or complete and it should not be relied on as such, as this document is for
general guidance only. Angel Broking Limited or any of its affiliates/ group companies shall not be in any way responsible for any loss
or damage that may arise to any person from any inadvertent error in the information contained in this report. Angel Broking Limited
has not independently verified all the information contained within this document. Accordingly, we cannot testify, nor make any
representation or warranty, express or implied, to the accuracy, contents or data contained within this document. While Angel Broking
Limited endeavors to update on a reasonable basis the information discussed in this material, there may be regulatory, compliance, or
other reasons that prevent us from doing so.
This document is being supplied to you solely for your information, and its contents, information or data may not be reproduced,
redistributed or passed on, directly or indirectly.
Neither Angel Broking Limited, nor its directors, employees or affiliates shall be liable for any loss or damage that may arise from or in
connection with the use of this information.
Disclosure of Interest Statement
TV Today Network
1. Financial interest of research analyst or Angel or his Associate or his relative
No
2. Ownership of 1% or more of the stock by research analyst or Angel or associates or relatives
No
3. Served as an officer, director or employee of the company covered under Research
No
4. Broking relationship with company covered under Research
No
Ratings (Based on expected returns
Buy (> 15%)
Accumulate (5% to 15%)
Neutral (-5 to 5%)
over 12 months investment period):
Reduce (-5% to -15%)
Sell (< -15)
August 13, 2019
8